IBM statistics software for finding relationships in data and predicting likely outcomes without deep statistics experience

Statistical software for quality improvement, process analysis and business data, available in the cloud
By Minitab
Quality engineers, product developers and business analysts are among the people Minitab Statistical Software is written for. It is a data analysis package that examines current and past data to find trends, predict patterns and show relationships between variables that are not obvious at first glance.
Minitab presents the software as a tool for quality and process improvement work, and says it covers needs from reliability engineering and product development to process validation, business analytics and predictive analytics. The range of analysis runs from simple hypothesis tests to checks on whether data follow a normal pattern or match a reference, and dynamic charts present the findings.
The company describes the platform as available in the cloud, so users can run analyses wherever they are, and says it is designed to be usable by people who are not specialist statisticians. Its latest announcement is an advanced design of experiments capability.
Minitab also offers training, either on site or virtual, an education hub and statistical consulting for organizations that want support with their analytics.
Minitab Statistical Software is a data analysis package used to find trends, predict patterns and uncover relationships between variables. It is made by Minitab, which sells it for quality and process improvement as well as general business analysis.
It is aimed at people with or without a statistical background across a company, from quality teams to business analysts.
Summary written by TrustList from the business's own published information, Nov 2026.
Used it? Your experience helps other buyers decide.
Write a reviewNo questions yet. Be the first to ask about Minitab Statistical Software.
Similar listings buyers compare against this one.
IBM statistics software for finding relationships in data and predicting likely outcomes without deep statistics experience
Analytics software from SAS for exploring data and building shareable interactive reports

Visual analytics and data science platform, with S+ as the statistical programming product in the Spotfire range
Web-based statistical analysis software that runs significance tests automatically for market researchers
Cloud platform for collecting, preparing and analysing data with guided statistical tests

Data visualisation and analysis tool for statistical, Six Sigma and design of experiments work
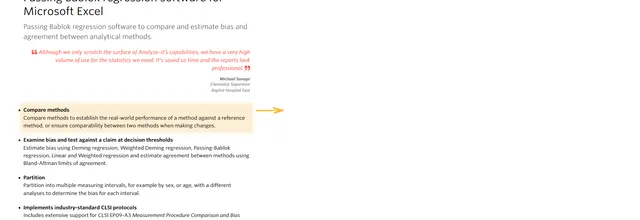
Statistics add-in for Microsoft Excel covering research, quality control and laboratory method validation
Cloud dashboard and data visualisation tool that links business apps and surfaces insights for owners
The newest guides and analysis from TrustList Insights.
 Brazil
22 Nov 2026
Receita Federal has opened the restricted CBS pilot environment to all companies without prior request, and has sent the accounting council…
 South Africa
22 Nov 2026
SARS matched National Treasury payments against nil VAT returns from Central Supplier Database suppliers, found 14,142 nil-return periods…
 United States of America
22 Nov 2026
OpenRouter has off-boarded three inference providers and removed 125 endpoints from Zero Data Retention after Dragos seeded about two…
Everything here links back to the same verified catalogue. Pick your next stop.